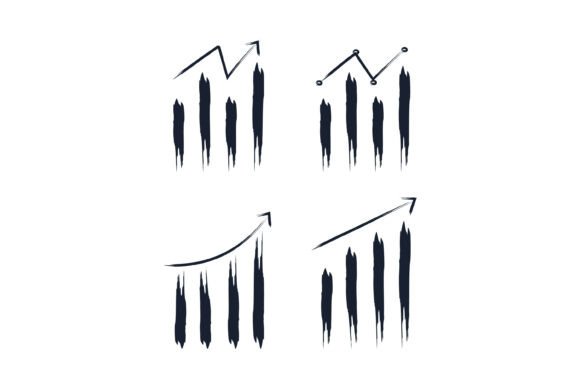
Hand-Drawn Business Growth Charts
Imagine presenting your quarterly revenue jump—not with a sterile, auto-generated Excel chart, but with a bold, ink-textured bar graph that looks like it was sketched by a confident hand during a productive morning brainstorm. That’s the quiet power of Hand-Drawn Business Growth Charts: a vector set designed not just to display numbers, but to invite attention, build trust, and humanize data.
Why “Hand-Drawn” Isn’t Just a Style Choice—It’s a Communication Strategy
In a world saturated with pixel-perfect dashboards and AI-generated reports, authenticity stands out. The Hand-Drawn Business Growth Charts – Abstract Brush Stroke Financial Infographic Vectors set features four distinct charts—bar graphs, line-and-arrow composites, stacked progress indicators—all rendered in expressive, dark ink-like brush strokes. This isn’t about nostalgia or whimsy. It’s about signaling intention: that growth isn’t just algorithmic—it’s driven by people, decisions, and momentum.
For a startup founder preparing a pitch deck, swapping a generic stock chart for one of these vectors can subtly shift audience perception. Investors still need clarity—but they also respond to cues of thoughtfulness and creative control. A hand-drawn upward-trending line doesn’t obscure data; it frames it as part of a story worth telling.
Where These Charts Deliver Real Value (Without Extra Work)
These aren’t decorative flourishes. They’re time-saving tools built for real workflows:
- Blog headers and social thumbnails: A single bar chart with visible brush texture draws the eye faster than a flat SVG in a crowded feed—especially on platforms like LinkedIn or Medium where visual hierarchy determines scroll behavior.
- Pitch decks for early-stage ventures: When you’re explaining traction to non-technical stakeholders, simplicity + warmth matters more than decimal precision. One of the included charts—featuring both bars and an ascending arrow—communicates “we’re growing, and here’s how”—in under three seconds.
- Educational materials for small business owners: A community college instructor teaching financial literacy used these vectors in workshop handouts. Students reported higher recall of concepts like “compound growth” and “month-over-month lift,” likely because the organic lines reduced cognitive load compared to rigid grid-based charts.
Designed for Flexibility—Not Just Aesthetics
All four charts are delivered as scalable vector files (AI, EPS, SVG), meaning they hold crisp detail whether placed on a 48” trade show banner or scaled down to a mobile app onboarding screen. Because they’re built with layered paths—not raster images—you can adjust stroke weight, recolor individual bars, or isolate the arrow element to pair with custom annotations.
That flexibility supports efficiency. A freelance marketer building a client’s Q3 recap report reused the same base bar chart across three slides—changing only color fills and label text—cutting 20 minutes off design time. No plugins, no learning curve: just open, edit, export.
Who Benefits Most—and Why Timing Matters
The Hand-Drawn Business Growth Charts set resonates most strongly with professionals who balance analytical rigor with audience empathy:
- Founders and solopreneurs who design their own decks, websites, or email campaigns—and need visuals that feel intentional, not outsourced.
- Educators and trainers creating accessible financial content for non-finance audiences (e.g., small retailers learning inventory turnover metrics).
- Content creators and bloggers covering topics like side-hustle income, SaaS metrics, or personal finance—where tone and relatability directly impact engagement.
- Marketing teams at mid-sized companies refreshing internal comms or external campaign assets without requiring full design briefs for every chart.
It’s less ideal for highly regulated reporting (e.g., SEC filings or audited financial statements), where standardized formatting and precise labeling conventions take priority over stylistic expression. If your use case demands strict adherence to GAAP-aligned charting rules—or requires dynamic data linking—the set functions best as a static visual layer, not a live dashboard component.
How to Use Them Without Overcomplicating Things
You don’t need design expertise. Start simple:
- Identify the core message: Is it “revenue doubled in six months”? Then choose the dual-bar chart with connecting arrow—it visually links two points in time.
- Open the SVG in Figma, Illustrator, or even PowerPoint (via “Insert > Picture”). Change the dark ink fill to match your brand palette—most users stick with deep navy or charcoal for contrast, then add one accent color for the growth indicator.
- Add minimal, high-contrast text labels. Because the brush texture adds visual weight, avoid thin fonts or light grays. Try bold sans-serifs at 16–18pt for headers, paired with clean numerals.
- Use sparingly. One well-placed Hand-Drawn Business Growth Charts element per slide or section is stronger than three competing visuals.
A Subtle Shift in How We Talk About Progress
Data visualization often defaults to neutrality—clean lines, muted palettes, predictable axes. But growth isn’t neutral. It’s effortful. Iterative. Occasionally messy. The slight irregularity of a hand-drawn stroke mirrors that reality. It acknowledges that behind every uptick is a team meeting, a pivot, a late-night revision.
That resonance extends beyond aesthetics. A nonprofit development officer shared that donors responded more warmly to annual impact reports using these charts—particularly older constituents who associated the ink texture with handwritten thank-you notes and tangible commitment. The visual didn’t change the numbers—but it changed how those numbers were received.
When to Consider Alternatives
This set excels when your goal is expressive clarity—not exhaustive analysis. If you regularly need:
- Multi-series comparison (e.g., five product lines across eight quarters),
- Real-time data integration (e.g., pulling live API feeds into charts), or
- Highly granular segmentation (e.g., cohort-based LTV/CAC breakdowns),
then pairing these vectors with a tool like Datawrapper or Flourish may be more effective. The Hand-Drawn Business Growth Charts serve best as final-mile visuals—polished, memorable, and human-centered—not as analytical engines.
Ultimately, choosing this set isn’t about rejecting professionalism. It’s about expanding what professionalism looks like: grounded in data, yes—but also warm, intentional, and unmistakably human.