Business Process Flowcharts and Workflow: Visual Clarity as a Strategic Lever
In today’s fast-paced organizational landscape, ambiguity is costly—not just in time or budget, but in alignment, accountability, and adaptability. A single misinterpreted handoff between departments can cascade into delayed product launches, inconsistent customer experiences, or compliance gaps. This is where Business Process Flowcharts and Workflow tools cease to be abstract diagrams and become operational infrastructure. They transform tacit knowledge into shared language, turning fragmented activity into coherent, observable, and improvable systems.
Why Visualization Matters Beyond the Whiteboard
Human cognition thrives on pattern recognition and spatial reasoning. While verbal descriptions of “how things get done” often rely on assumptions and memory, a well-constructed flowchart externalizes logic—making dependencies visible, bottlenecks obvious, and decision points explicit. Consider a customer onboarding sequence: sales closes the deal → CRM triggers notification → operations assigns account manager → finance generates invoice → support initiates welcome call. Describing this linearly works—but only if everyone shares the same mental model. A visual workflow reveals what’s missing: What happens if the CRM fails? Is there a fallback? Who owns escalation? Where does approval sit—and how long does it typically take?
This isn’t about drawing boxes and arrows for aesthetics. It’s about constructing a living reference—a shared source of truth that supports training, auditing, scaling, and continuous improvement. When teams refer to the *same* diagram during retrospectives or cross-functional workshops, misalignment drops. When new hires study the documented workflow before their first sprint, ramp-up time shortens. When leadership reviews process maps alongside performance metrics, strategic investments gain precision.
Design Integrity Meets Practical Flexibility
The most effective Business Process Flowcharts and Workflow assets aren’t rigid templates—they’re intelligent frameworks built for real-world iteration. That’s why editable vector design isn’t a convenience feature; it’s foundational. Unlike raster images or locked PDFs, vector-based flowcharts scale infinitely without pixelation—critical when adapting diagrams for diverse outputs: a 4K presentation slide, a printed internal SOP poster, or an embedded SVG in a digital knowledge base. Resizing doesn’t distort text, line weights, or icon proportions—preserving legibility at every size.
Equally vital is the 100-color customizability. Corporate identity isn’t optional—it’s functional. A healthcare provider may use calming blues and greens to signal trust and continuity across patient journey maps. A fintech startup might deploy high-contrast gradients to highlight risk assessment stages in a fraud detection workflow. Color isn’t decorative here; it encodes meaning. Consistent hue application across related processes (e.g., all “approval” steps in amber, all “automated” actions in teal) creates instant visual scanning cues—reducing cognitive load during review or presentation.
Real-World Applications Across Roles and Sectors
What makes these resources universally relevant isn’t their technical specs—but how naturally they integrate into varied workflows:
- Business owners use them to map service delivery from inquiry to renewal—identifying where manual tasks slow growth or where automation could reduce churn. One SaaS founder discovered, via a simple flowchart, that 73% of support tickets originated from unclear onboarding instructions—prompting a targeted redesign that cut ticket volume by 41% in two months.
- Educators and trainers embed minimal timeline elements into process diagrams to teach procedural thinking—say, illustrating the peer review cycle in academic publishing or lab safety protocols. The clean structure avoids visual noise while emphasizing sequence and consequence.
- Researchers and analysts layer flowcharts over qualitative data—mapping interview themes onto “decision point” nodes or annotating observed delays beside specific activities. This bridges narrative insight with structural analysis.
- Branding and design teams treat workflow infographics as extension assets—not just internal tools, but client-facing deliverables. A marketing agency presents campaign execution flowcharts branded with client colors and typography, reinforcing professionalism and transparency in pitch decks and scope documents.
- Hobbyists and solopreneurs adopt simplified versions to systematize creative work: tracking podcast episode production (script → recording → editing → publishing → promotion), managing freelance project lifecycles, or even planning community event logistics. Clarity enables consistency—even at small scale.
Workflow Infographic Bundles: More Than Just Pretty Pictures
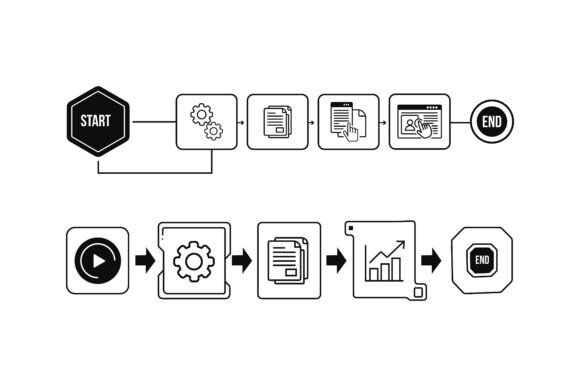
A modern workflow infographic bundle goes beyond isolated charts. It’s a cohesive system—designed with interoperability in mind. Think of it as a visual toolkit: standardized symbols (consistent arrow styles, uniform node shapes), harmonized spacing rules, and modular components (decision diamonds, parallel path connectors, swimlane dividers) that snap together predictably. This consistency matters because it reduces learning overhead. Once a team understands one diagram’s conventions, they intuitively read others—even across departments.
The inclusion of minimal timeline elements is especially pragmatic. Not every process is sequential—but many have temporal dimensions that impact outcomes. Adding subtle date markers, phase durations, or milestone indicators (without cluttering the core flow) helps stakeholders grasp cadence: How long does QA typically take? When does legal review occur relative to beta release? Where are seasonal peaks in request volume? These aren’t afterthoughts—they’re diagnostic anchors.
Implementation That Sticks: From Diagram to Discipline
Creating a beautiful flowchart is easy. Sustaining its relevance is harder. Success hinges on three interlocking practices:
- Co-creation over top-down imposition. Involve frontline staff—the people who actually execute the process—in mapping sessions. Their lived experience surfaces edge cases no manager anticipates: “We skip Step 4 unless the client is international,” or “That approval usually takes 3 days, but if Maria’s on vacation, it’s 10.” Diagrams built *with* users earn buy-in and accuracy.
- Version discipline and living documentation. Store source files (EPS included) in a shared, version-controlled repository—not buried in personal folders. Tag revisions with dates and change summaries (“v2.1: Added exception path for expired credit checks”). Outdated diagrams erode trust faster than no diagram at all.
- Link visuals to action. A flowchart shouldn’t live in isolation. Connect it to real tools: hyperlink nodes to relevant SOPs in your intranet, embed QR codes in printed posters that lead to video walkthroughs, or annotate digital versions with RACI matrices (Responsible, Accountable, Consulted, Informed) directly on swimlanes.
Choosing the Right Foundation
Not all flowchart resources serve equally well. Generic clipart-style icons or low-resolution PNGs break down under scrutiny—especially when zoomed in a boardroom or printed for workshop use. Raster-based files resist meaningful editing; changing a single color means repainting entire sections. And without source files (like EPS), customization becomes prohibitively time-consuming—or impossible.
This is where purpose-built assets shine. Fully editable vector design ensures fidelity at any scale. 100-color customizability allows seamless brand integration without compromising clarity. Easy resizing and modification mean updates happen in minutes—not hours. And having source files means full control: you’re not dependent on third-party designers for routine adjustments or urgent revisions.
Looking Ahead: Flowcharts as Adaptive Infrastructure
The future of Business Process Flowcharts and Workflow isn’t static—it’s increasingly dynamic. We’re seeing early adoption of interactive web-based flowcharts that pull live data (e.g., showing real-time queue lengths at each stage), or AI-assisted diagramming tools that suggest optimizations based on historical cycle times. But even today’s foundational assets play a critical role: they establish the baseline understanding required before automation, integration, or AI augmentation make sense.
After all, you can’t optimize what you haven’t first made visible, agreed upon, and documented with fidelity. Whether you’re streamlining a manufacturing line, designing a university admissions portal, or launching a community garden initiative, clarity in process is the first act of intentionality. It signals respect—for your team’s time, your customers’ expectations, and your organization’s capacity to learn, adapt, and grow.
When flowcharts are treated not as artifacts, but as living instruments—designed with rigor, maintained with care, and applied with purpose—they become more than diagrams. They become the quiet architecture of reliable execution.